Pandas
Sun 29 June 2025
import pandas as pd
s = pd.Series([10, 20, 30])
print(s)
0    10
1    20
2    30
dtype: int64
s = pd.Series([10, 20, 30], index=['a', 'b', 'c'])
print(s)
a    10
b    20
c    30
dtype: int64
s = pd.Series({'a': 1, 'b': 2})
print(s)
a    1
b    2
dtype: int64
print(s['a'])
1
print(s[s > 1])
b    2
dtype: int64
s1 = pd.Series([1, 2])
s2 = pd.Series([3, 4])
print(s1 + s2)
0    4
1    6
dtype: int64
s = pd.Series([1, None, 3])
print(s.isnull())
0    False
1     True
2    False
dtype: bool
print(s.fillna(0))
0    1.0
1    0.0
2    3.0
dtype: float64
print(s.dropna())
0    1.0
2    3.0
dtype: float64
s.name = "my_series"
print(s.name)
my_series
df = pd.DataFrame({'A': [1, 2], 'B': [3, 4]})
print(df)
   A  B
0  1  3
1  2  4
df = pd.DataFrame([[1, 2], [3, 4]], columns=['A', 'B'])
print(df)
   A  B
0  1  2
1  3  4
df = pd.DataFrame({'A': [1, 2]}, index=['x', 'y'])
print(df)
   A
x  1
y  2
s1 = pd.Series([1, 2], name='X')
s2 = pd.Series([3, 4], name='Y')
df = pd.concat([s1, s2], axis=1)
print(df)
   X  Y
0  1  3
1  2  4
print(pd.DataFrame())
Empty DataFrame
Columns: []
Index: []
df = pd.DataFrame({'A': [1, None], 'B': [None, 4]})
print(df)
     A    B
0  1.0  NaN
1  NaN  4.0
df['C'] = [5, 6]
print(df)
     A    B  C
0  1.0  NaN  5
1  NaN  4.0  6
del df['C']
print(df)
     A    B
0  1.0  NaN
1  NaN  4.0
df.insert(1, 'C', [9, 8])
print(df)
     A  C    B
0  1.0  9  NaN
1  NaN  8  4.0
df = df.rename(columns={'A': 'X'})
print(df)
     X  C    B
0  1.0  9  NaN
1  NaN  8  4.0
print(df.head())
     X  C    B
0  1.0  9  NaN
1  NaN  8  4.0
print(df.tail())
     X  C    B
0  1.0  9  NaN
1  NaN  8  4.0
print(df.shape)
(2, 3)
print(df.columns)
Index(['X', 'C', 'B'], dtype='object')
print(df.index)
RangeIndex(start=0, stop=2, step=1)
print(df.dtypes)
X    float64
C      int64
B    float64
dtype: object
print(df.info())
<class 'pandas.core.frame.DataFrame'>
RangeIndex: 2 entries, 0 to 1
Data columns (total 3 columns):
 #   Column  Non-Null Count  Dtype
---  ------  --------------  -----
 0   X       1 non-null      float64
 1   C       2 non-null      int64
 2   B       1 non-null      float64
dtypes: float64(2), int64(1)
memory usage: 180.0 bytes
None
print(df.describe())
         X         C    B
count  1.0  2.000000  1.0
mean   1.0  8.500000  4.0
std    NaN  0.707107  NaN
min    1.0  8.000000  4.0
25%    1.0  8.250000  4.0
50%    1.0  8.500000  4.0
75%    1.0  8.750000  4.0
max    1.0  9.000000  4.0
print(df.count())
X    1
C    2
B    1
dtype: int64
print(df.memory_usage())
Index    132
X         16
C         16
B         16
dtype: int64
print(df.memory_usage())
Index    132
X         16
C         16
B         16
dtype: int64
print(df[['X', 'B']])
     X    B
0  1.0  NaN
1  NaN  4.0
print(df.iloc[0])
X    1.0
C    9.0
B    NaN
Name: 0, dtype: float64
print(df[df['X'] > 1])
Empty DataFrame
Columns: [X, C, B]
Index: []
df = df.set_index('X')
print(df)
     C    B
X
1.0  9  NaN
NaN  8  4.0
print(df.reset_index())
     X  C    B
0  1.0  9  NaN
1  NaN  8  4.0
print('X' in df.columns)
False
print(df.iat[0, 0])
9
df = pd.DataFrame({'A': [3, 1, 2]})
print(df.sort_values('A'))
   A
1  1
2  2
0  3
print(df.sort_index())
   A
0  3
1  1
2  2
print(df.sort_values('A', ascending=False))
   A
0  3
2  2
1  1
df = pd.DataFrame({'A': [1, 1, 2], 'B': [3, 2, 1]})
print(df.sort_values(['A', 'B']))
   A  B
1  1  2
0  1  3
2  2  1
s = pd.Series([3, 1, 2])
print(s.sort_values())
1    1
2    2
0    3
dtype: int64
print(s.argsort())
0    1
1    2
2    0
dtype: int64
print(s.rank())
0    3.0
1    1.0
2    2.0
dtype: float64
print(s.sort_index())
0    3
1    1
2    2
dtype: int64
print(s.nlargest(2))
0    3
2    2
dtype: int64
print(s.nsmallest(2))
1    1
2    2
dtype: int64
df = pd.DataFrame({'A': [1, None]})
print(df.isnull().any())
A    True
dtype: bool
print(df.notnull().all())
A    False
dtype: bool
print(df.fillna(df.mean()))
     A
0  1.0
1  1.0
print(df.fillna(df.median()))
     A
0  1.0
1  1.0
df = pd.DataFrame({'A': [1, None, 3]})
print(df.interpolate())
     A
0  1.0
1  2.0
2  3.0
print(df.isnull().sum())
A    1
dtype: int64
df.fillna(0, inplace=True)
print(df)
     A
0  1.0
1  0.0
2  3.0
df = pd.DataFrame({'A': [1, None], 'B': [2, 3]})
print(df[df.notnull().all(axis=1)])
     A  B
0  1.0  2
df = pd.DataFrame({'A': [1, 1, 2]})
print(df.drop_duplicates())
   A
0  1
2  2
print(df.drop_duplicates(keep='first'))
   A
0  1
2  2
df = pd.DataFrame({'A': ['1', '2']})
df['A'] = df['A'].astype(float)
print(df)
     A
0  1.0
1  2.0
df['A'] = df['A'].astype(int)
print(df)
   A
0  1
1  2
df['A'] = df['A'].astype(str)
print(df)
   A
0  1
1  2
df = pd.DataFrame({'A': [1, 2], 'B': [3, 4]})
print(df.astype(float))
     A    B
0  1.0  3.0
1  2.0  4.0
print(df.apply(lambda x: x.astype(str)))
   A  B
0  1  3
1  2  4
df = pd.DataFrame({'date': ['2025-01-01', '2025-02-01']})
df['date'] = pd.to_datetime(df['date'])
print(df)
        date
0 2025-01-01
1 2025-02-01
print(df.dtypes)
date    datetime64[ns]
dtype: object
print(df['date'].tolist())
[Timestamp('2025-01-01 00:00:00'), Timestamp('2025-02-01 00:00:00')]
print(df.to_dict())
{'date': {0: Timestamp('2025-01-01 00:00:00'), 1: Timestamp('2025-02-01 00:00:00')}}
print(df.values)
[['2025-01-01T00:00:00.000000000']
 ['2025-02-01T00:00:00.000000000']]
df = pd.DataFrame({'A': ['foo', 'foo', 'bar'], 'B': [1, 2, 3]})
grouped = df.groupby('A')
print(grouped.sum())
     B
A
bar  3
foo  3
print(df.groupby('A').mean())
       B
A
bar  3.0
foo  1.5
print(df.groupby('A').count())
     B
A
bar  1
foo  2
print(df.groupby('A').agg(['sum', 'mean']))
      B
    sum mean
A
bar   3  3.0
foo   3  1.5
print(df.groupby('A')['B'].agg('max'))
A
bar    3
foo    2
Name: B, dtype: int64
df = pd.DataFrame({'A': ['foo', 'foo', 'bar'], 'B': ['x', 'y', 'x'], 'C': [1, 2, 3]})
print(df.groupby(['A', 'B']).sum())
       C
A   B
bar x  3
foo x  1
    y  2
print(df.groupby('A')['C'].apply(lambda x: x.max() - x.min()))
A
bar    0
foo    1
Name: C, dtype: int64
print(df.groupby('A').sum().reset_index())
     A   B  C
0  bar   x  3
1  foo  xy  3
print(df.groupby('A').filter(lambda x: x['C'].sum() > 2))
     A  B  C
0  foo  x  1
1  foo  y  2
2  bar  x  3
print(df.groupby('A')['C'].transform('sum'))
0    3
1    3
2    3
Name: C, dtype: int64
df = pd.DataFrame({'A': [1, 2, 3, 4, 5]})
print(df['A'].rolling(2).mean())
0    NaN
1    1.5
2    2.5
3    3.5
4    4.5
Name: A, dtype: float64
print(df['A'].rolling(3).sum())
0     NaN
1     NaN
2     6.0
3     9.0
4    12.0
Name: A, dtype: float64
print(df['A'].rolling(2).max())
0    NaN
1    2.0
2    3.0
3    4.0
4    5.0
Name: A, dtype: float64
print(df['A'].expanding().mean())
0    1.0
1    1.5
2    2.0
3    2.5
4    3.0
Name: A, dtype: float64
print(df['A'].expanding().sum())
0     1.0
1     3.0
2     6.0
3    10.0
4    15.0
Name: A, dtype: float64
print(df['A'].rolling(2).apply(lambda x: x.max() - x.min()))
0    NaN
1    1.0
2    1.0
3    1.0
4    1.0
Name: A, dtype: float64
print(df['A'].rolling(3, min_periods=1).mean())
0    1.0
1    1.5
2    2.0
3    3.0
4    4.0
Name: A, dtype: float64
print(df['A'].cumsum())
0     1
1     3
2     6
3    10
4    15
Name: A, dtype: int64
print(df['A'].cumprod())
0      1
1      2
2      6
3     24
4    120
Name: A, dtype: int64
print(df['A'].cummax())
0    1
1    2
2    3
3    4
4    5
Name: A, dtype: int64
s = pd.Series(['Hello', 'World'])
print(s.str.lower())
0    hello
1    world
dtype: object
print(s.str.upper())
0    HELLO
1    WORLD
dtype: object
print(s.str.len())
0    5
1    5
dtype: int64
print(s.str.contains('o'))
0    True
1    True
dtype: bool
print(s.str.replace('l', 'x'))
0    Hexxo
1    Worxd
dtype: object
print(s.str.startswith('H'))
0     True
1    False
dtype: bool
print(s.str.endswith('d'))
0    False
1     True
dtype: bool
s = pd.Series([' A ', ' B '])
print(s.str.strip())
0    A
1    B
dtype: object
s = pd.Series(['a,b,c', '1,2,3'])
print(s.str.split(','))
0    [a, b, c]
1    [1, 2, 3]
dtype: object
df1 = pd.DataFrame({'A': [1, 2]})
df2 = pd.DataFrame({'A': [3, 4]})
print(pd.concat([df1, df2]))
   A
0  1
1  2
0  3
1  4
df1 = pd.DataFrame({'key': ['A', 'B'], 'val1': [1, 2]})
df2 = pd.DataFrame({'key': ['A', 'B'], 'val2': [3, 4]})
print(pd.merge(df1, df2, on='key'))
  key  val1  val2
0   A     1     3
1   B     2     4
df1 = pd.DataFrame({'k1': ['A', 'B'], 'val1': [1, 2]})
df2 = pd.DataFrame({'k2': ['A', 'B'], 'val2': [3, 4]})
print(pd.merge(df1, df2, left_on='k1', right_on='k2'))
  k1  val1 k2  val2
0  A     1  A     3
1  B     2  B     4
print(pd.merge(df1, df2, left_on='k1', right_on='k2', how='outer'))
  k1  val1 k2  val2
0  A     1  A     3
1  B     2  B     4
print(pd.merge(df1, df2, left_on='k1', right_on='k2', how='inner'))
  k1  val1 k2  val2
0  A     1  A     3
1  B     2  B     4
df1 = pd.DataFrame({'val1': [1, 2]}, index=['A', 'B'])
df2 = pd.DataFrame({'val2': [3, 4]}, index=['A', 'B'])
print(df1.join(df2))
   val1  val2
A     1     3
B     2     4
df2 = df2.rename_axis('idx')
print(df1.join(df2, how='left'))
   val1  val2
A     1     3
B     2     4
print(pd.concat([df1, new_row]).reset_index())
  index  val1
0     A     1
1     B     2
2     C     5
df = pd.DataFrame({'A': [1, 2], 'B': [3, 4]})
df.to_csv('output.csv', index=False)
df.to_excel('output.xlsx', index=False)
df.to_json('output.json', orient='records')
df.to_pickle('data.pkl')
df_loaded = pd.read_pickle('data.pkl')
print(df_loaded)
   A  B
0  1  3
1  2  4
import matplotlib.pyplot as plt
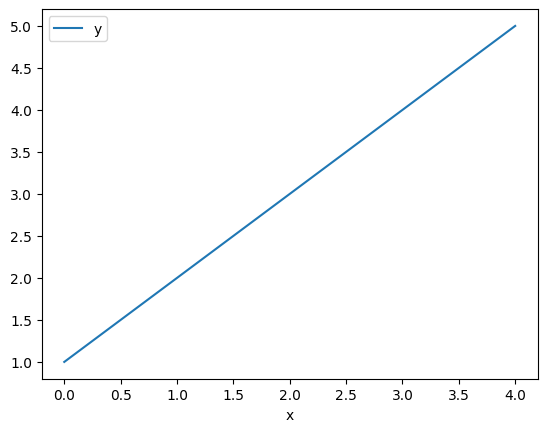
df = pd.DataFrame({'x': range(5), 'y': [1, 2, 3, 4, 5]})
df.plot(x='x', y='y')
plt.show()
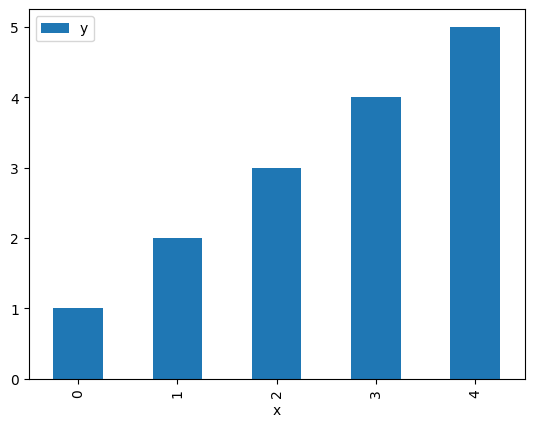
df.plot.bar(x='x', y='y')
plt.show()
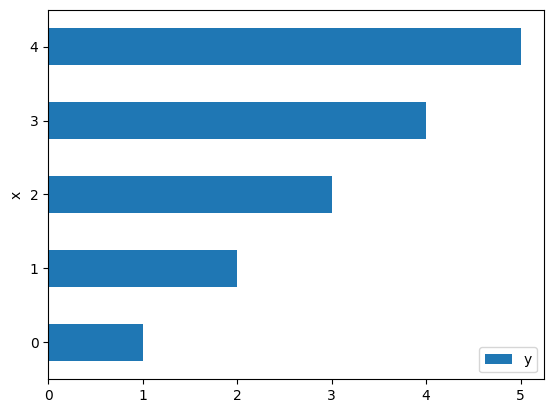
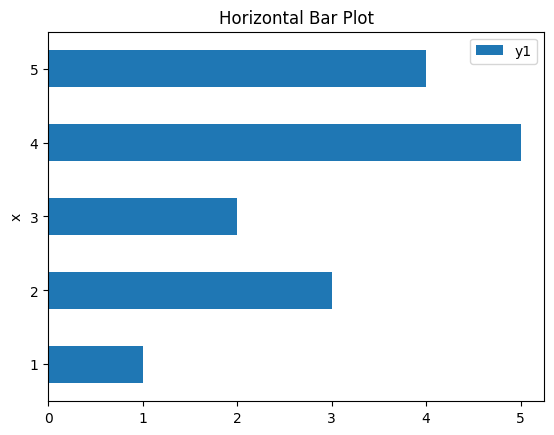
df.plot.barh(x='x', y='y')
plt.show()
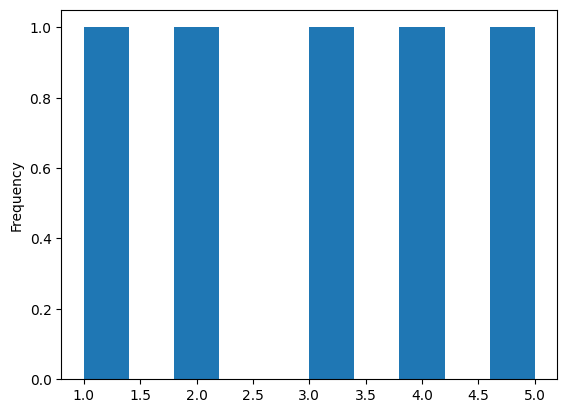
df['y'].plot.hist()
plt.show()
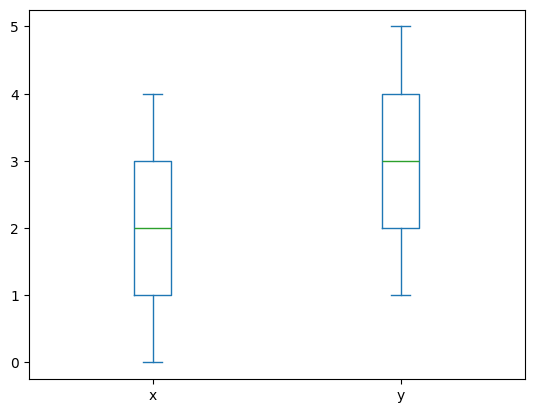
df.plot.box()
plt.show()
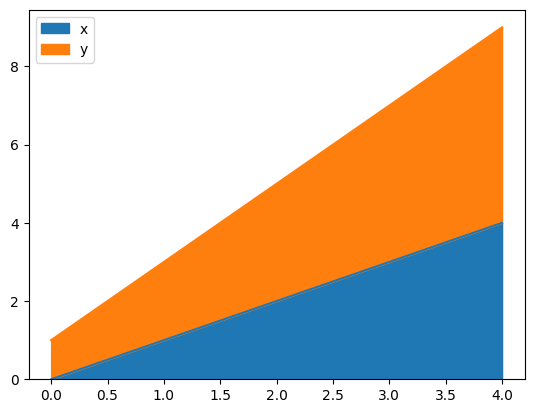
df.plot.area()
plt.show()
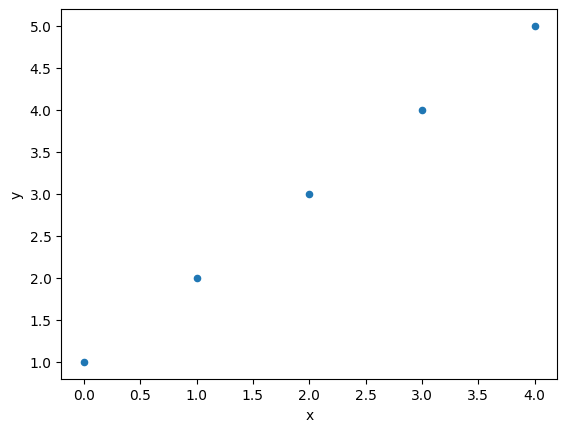
df.plot.scatter(x='x', y='y')
plt.show()
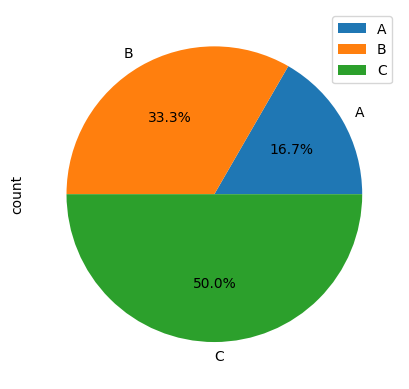
df = pd.DataFrame({'category': ['A', 'B', 'C'], 'count': [10, 20, 30]})
df.set_index('category').plot.pie(y='count', autopct='%1.1f%%')
plt.show()
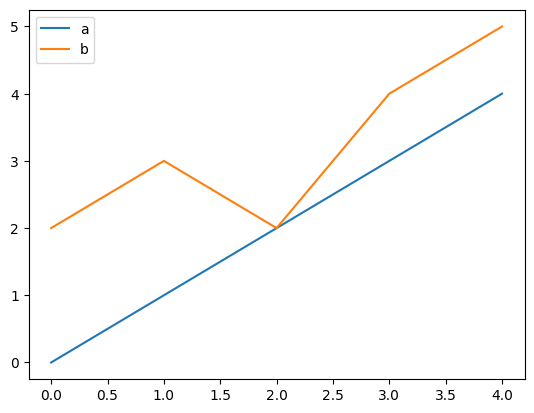
df2 = pd.DataFrame({'a': range(5), 'b': [2, 3, 2, 4, 5]})
df2.plot()
plt.show()
arrays = [['A', 'A', 'B', 'B'], [1, 2, 1, 2]]
index = pd.MultiIndex.from_arrays(arrays, names=('letters', 'numbers'))
df = pd.DataFrame({'value': [10, 20, 30, 40]}, index=index)
print(df)
                 value
letters numbers
A       1           10
        2           20
B       1           30
        2           40
import pandas as pd
import matplotlib.pyplot as plt
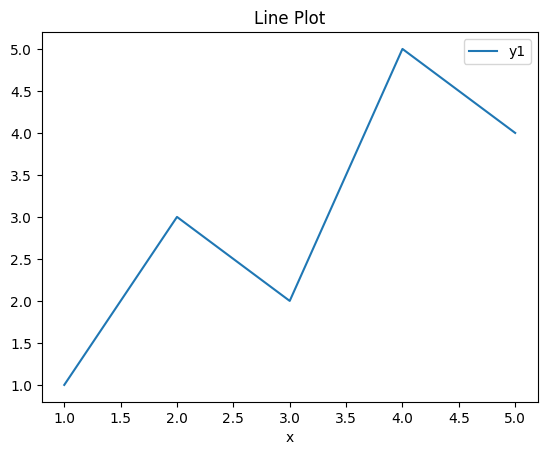
df = pd.DataFrame({
    'x': range(1, 6),
    'y1': [1, 3, 2, 5, 4],
    'y2': [2, 4, 1, 3, 5]
})
df.plot(x='x', y='y1')
plt.title("Line Plot")
plt.show()
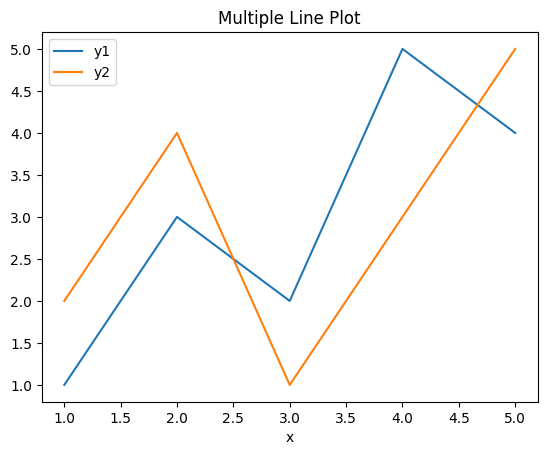
df.plot(x='x', y=['y1', 'y2'])
plt.title("Multiple Line Plot")
plt.show()
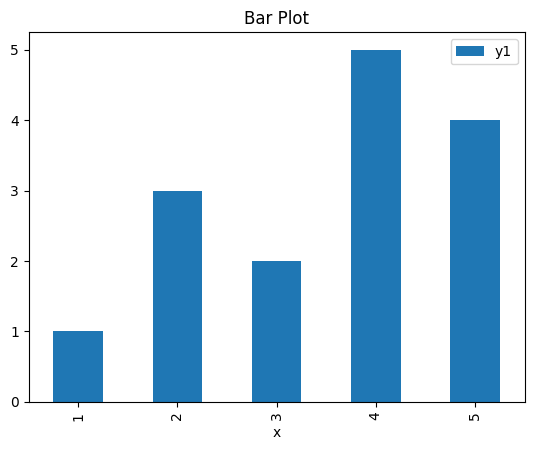
df.plot.bar(x='x', y='y1')
plt.title("Bar Plot")
plt.show()
df.plot.barh(x='x', y='y1')
plt.title("Horizontal Bar Plot")
plt.show()
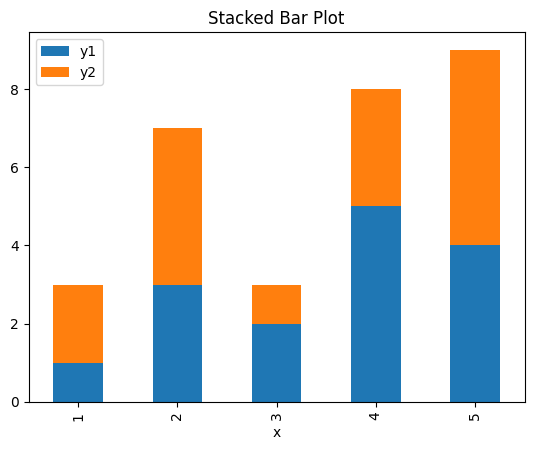
df.plot.bar(x='x', y=['y1', 'y2'], stacked=True)
plt.title("Stacked Bar Plot")
plt.show()
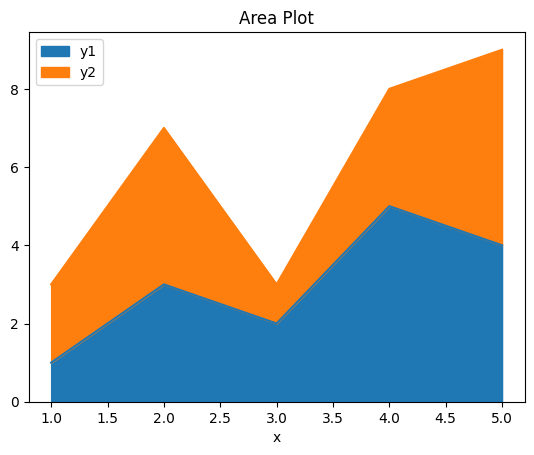
df.plot.area(x='x', y=['y1', 'y2'])
plt.title("Area Plot")
plt.show()
df.plot.area(x='x', y=['y1', 'y2'], stacked=True)
plt.title("Stacked Area Plot")
plt.show()

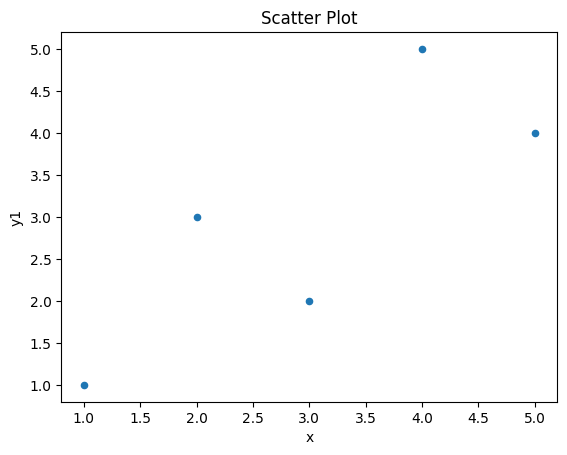
df.plot.scatter(x='x', y='y1')
plt.title("Scatter Plot")
plt.show()
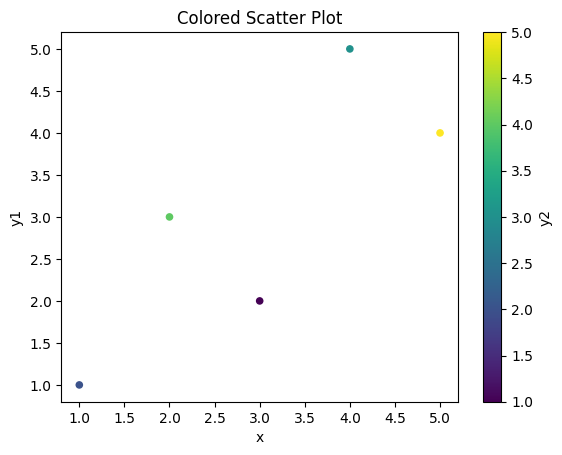
df.plot.scatter(x='x', y='y1', c='y2', cmap='viridis')
plt.title("Colored Scatter Plot")
plt.show()
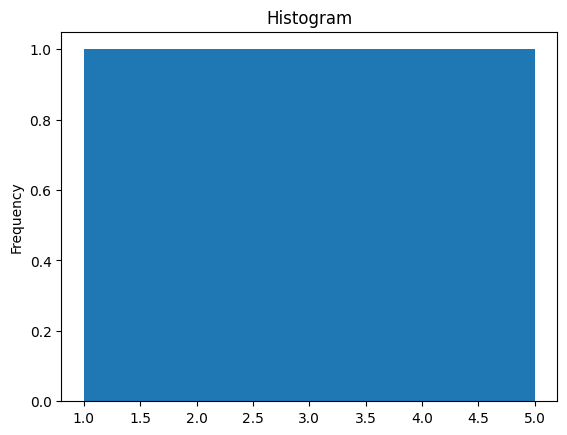
df['y1'].plot.hist(bins=5)
plt.title("Histogram")
plt.show()
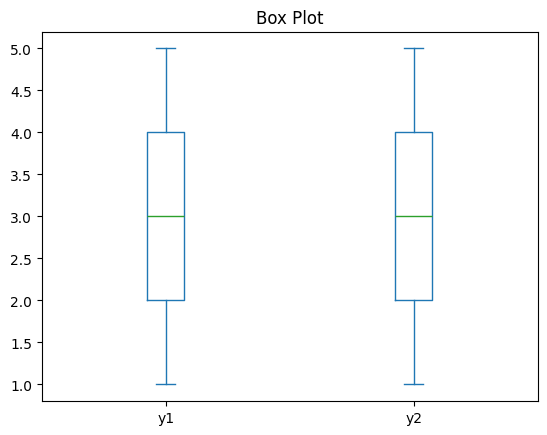
df[['y1', 'y2']].plot.box()
plt.title("Box Plot")
plt.show()
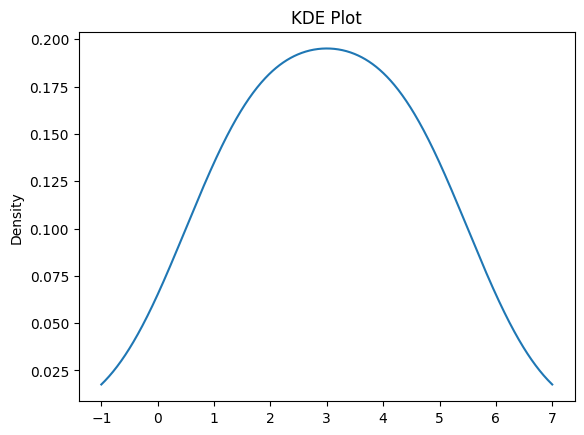
df['y1'].plot.kde()
plt.title("KDE Plot")
plt.show()
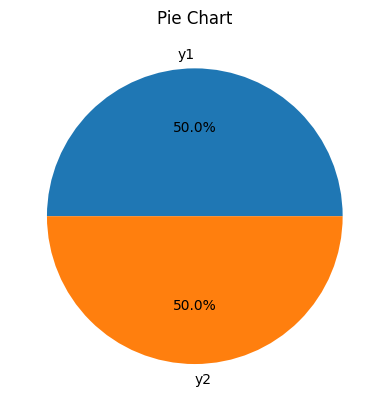
df_sum = df[['y1', 'y2']].sum()
df_sum.plot.pie(autopct='%1.1f%%')
plt.title("Pie Chart")
plt.ylabel("")
plt.show()
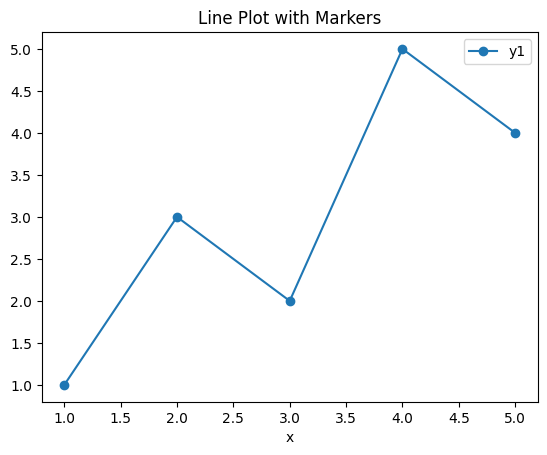
df.plot(x='x', y='y1', marker='o')
plt.title("Line Plot with Markers")
plt.show()
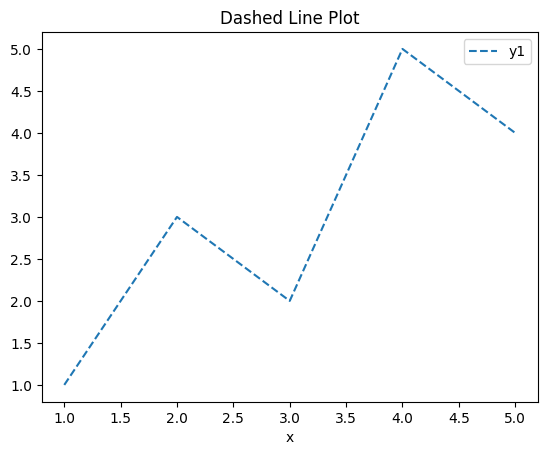
df.plot(x='x', y='y1', style='--')
plt.title("Dashed Line Plot")
plt.show()
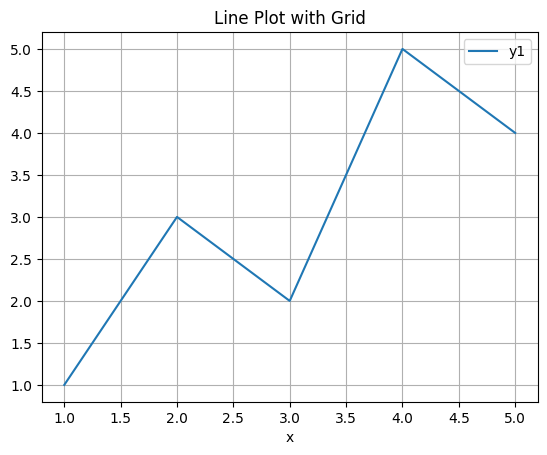
df.plot(x='x', y='y1', grid=True)
plt.title("Line Plot with Grid")
plt.show()
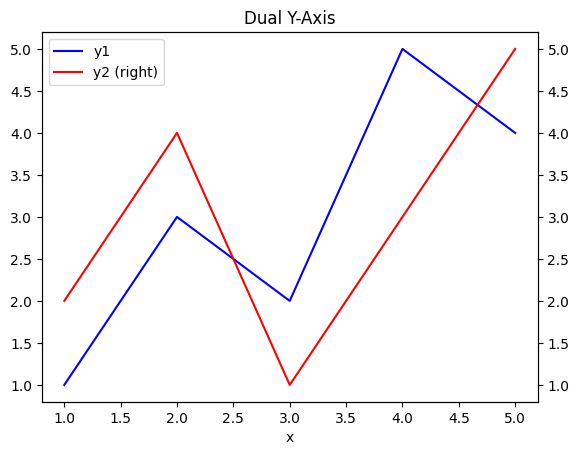
ax = df.plot(x='x', y='y1', color='blue', label='y1')
df.plot(x='x', y='y2', ax=ax, color='red', secondary_y=True, label='y2')
plt.title("Dual Y-Axis")
plt.show()
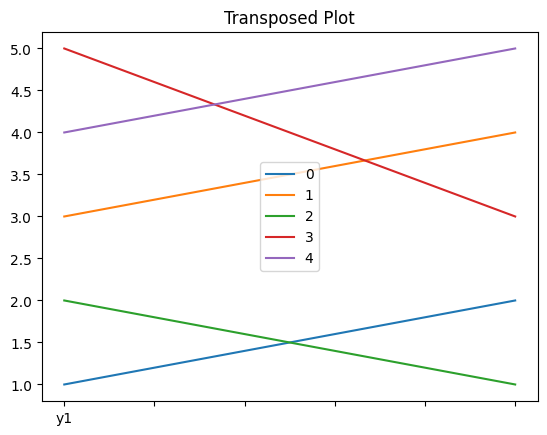
df.drop('x', axis=1).T.plot()
plt.title("Transposed Plot")
plt.show()
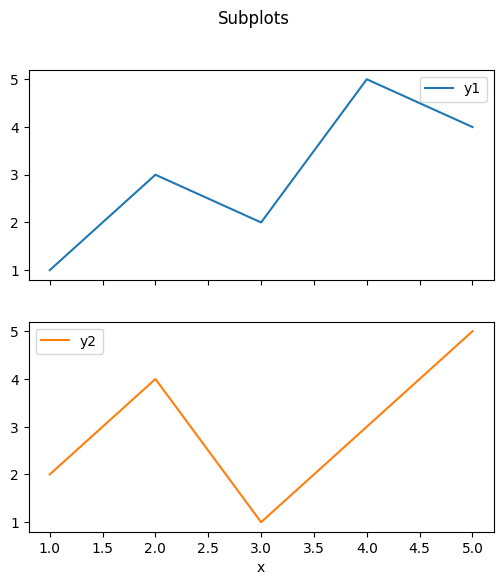
df.set_index('x').plot(subplots=True, layout=(2, 1), figsize=(6, 6))
plt.suptitle("Subplots")
plt.show()
df.plot(x='x', y='y1')
plt.title("Saved Plot")
plt.savefig("line_plot.png")
plt.close()
arrays = [['A', 'A', 'B', 'B'], [1, 2, 1, 2]]
index = pd.MultiIndex.from_arrays(arrays, names=('letters', 'numbers'))
df = pd.DataFrame({'value': [10, 20, 30, 40]}, index=index)
print(df)
                 value
letters numbers
A       1           10
        2           20
B       1           30
        2           40
print(df.loc[('A', 1)])
value    10
Name: (A, 1), dtype: int64
print(df.loc['A'])
         value
numbers
1           10
2           20
print(df.reset_index())
  letters  numbers  value
0       A        1     10
1       A        2     20
2       B        1     30
3       B        2     40
df2 = df.reset_index().set_index(['letters', 'numbers'])
print(df2)
                 value
letters numbers
A       1           10
        2           20
B       1           30
        2           40
print(df.sort_index())
                 value
letters numbers
A       1           10
        2           20
B       1           30
        2           40
print(df.swaplevel())
                 value
numbers letters
1       A           10
2       A           20
1       B           30
2       B           40
print(df.index.names)
['letters', 'numbers']
print(df.index.get_level_values(0))
Index(['A', 'A', 'B', 'B'], dtype='object', name='letters')
print(df.groupby(level='letters').sum())
         value
letters
A           30
B           70
df = pd.DataFrame({'A': range(1000)})
print(df.memory_usage(deep=True))
Index     132
A        8000
dtype: int64
df['A'] = df['A'].astype('int16')
print(df.dtypes)
A    int16
dtype: object
df['B'] = pd.Series([1.5]*1000).astype('float32')
print(df.dtypes)
A      int16
B    float32
dtype: object
df['C'] = pd.Series(['a']*500 + ['b']*500)
df['C'] = df['C'].astype('category')
print(df.dtypes)
A       int16
B     float32
C    category
dtype: object
df['A'] = df['A'] + 1
df.loc[0, 'A'] = 999
df['D'] = df['A'] * 2
import numpy as np
df['E'] = np.log1p(df['A'])
df_large = pd.DataFrame(np.zeros((10000, 10)))
dates = pd.date_range(start='2025-01-01', periods=5, freq='D')
print(dates)
DatetimeIndex(['2025-01-01', '2025-01-02', '2025-01-03', '2025-01-04',
               '2025-01-05'],
              dtype='datetime64[ns]', freq='D')
df = pd.DataFrame({'date': dates, 'value': [1, 2, 3, 4, 5]})
df.set_index('date', inplace=True)
print(df)
            value
date
2025-01-01      1
2025-01-02      2
2025-01-03      3
2025-01-04      4
2025-01-05      5
print(df.rolling(2).mean())
            value
date
2025-01-01    NaN
2025-01-02    1.5
2025-01-03    2.5
2025-01-04    3.5
2025-01-05    4.5
print(df.shift(1))
            value
date
2025-01-01    NaN
2025-01-02    1.0
2025-01-03    2.0
2025-01-04    3.0
2025-01-05    4.0
print(df.pct_change())
               value
date
2025-01-01       NaN
2025-01-02  1.000000
2025-01-03  0.500000
2025-01-04  0.333333
2025-01-05  0.250000
print(df.index.to_series().diff())
date
2025-01-01      NaT
2025-01-02   1 days
2025-01-03   1 days
2025-01-04   1 days
2025-01-05   1 days
Name: date, dtype: timedelta64[ns]
print(df.loc['2025-01-03'])
value    3
Name: 2025-01-03 00:00:00, dtype: int64
print(df['2025-01-02':'2025-01-04'])
value
date
2025-01-02 2
2025-01-03 3
2025-01-04 4
df = pd.DataFrame({'year': [2025]*3, 'month': [1, 2, 3], 'day': [1, 2, 3]})
df['date'] = pd.to_datetime(df[['year', 'month', 'day']])
print(df)
year month day date
0 2025 1 1 2025-01-01
1 2025 2 2 2025-02-02
2 2025 3 3 2025-03-03
df = pd.DataFrame({'A': [1, 2], 'B': [[1, 2], [3, 4]]})
print(df.explode('B'))
A B
0 1 1
0 1 2
1 2 3
1 2 4
df = pd.DataFrame({'id': [1], 'Jan': [10], 'Feb': [20]})
print(pd.melt(df, id_vars='id', var_name='month', value_name='sales'))
id month sales
0 1 Jan 10
1 1 Feb 20
df = pd.DataFrame({'id': [1, 1], 'month': ['Jan', 'Feb'], 'sales': [10, 20]})
print(df.pivot(index='id', columns='month', values='sales'))
month Feb Jan
id
1 20 10
df = pd.DataFrame({'A': [1, 2], 'B': [3, 4]})
print(df.stack())
0 A 1
B 3
1 A 2
B 4
dtype: int64
print(df.stack().unstack())
A B
0 1 3
1 2 4
arrays = [['A', 'A', 'B'], ['one', 'two', 'one']]
df = pd.DataFrame([[1, 2, 3]], columns=pd.MultiIndex.from_arrays(arrays))
print(df)
A B
one two one
0 1 2 3
df.columns = ['_'.join(col) for col in df.columns.values]
print(df)
A_one A_two B_one
0 1 2 3
df = pd.DataFrame({'id': [1, 2, 1], 'month': ['Jan', 'Jan', 'Feb'], 'val': [10, 20, 30]})
print(df.groupby(['id', 'month'])['val'].sum().unstack())
month Feb Jan
id
1 30.0 10.0
2 NaN 20.0
df1 = pd.DataFrame({'time': pd.to_datetime(['2025-01-01', '2025-01-03']), 'val1': [1, 2]})
df2 = pd.DataFrame({'time': pd.to_datetime(['2025-01-02', '2025-01-04']), 'val2': [3, 4]})
print(pd.merge_asof(df1, df2, on='time'))
time val1 val2
0 2025-01-01 1 NaN
1 2025-01-03 2 3.0
df1 = pd.DataFrame({'A': [1, 2]})
df2 = pd.DataFrame({'B': ['x', 'y']})
print(df1.merge(df2, how='cross'))
A B
0 1 x
1 1 y
2 2 x
3 2 y
df1 = pd.DataFrame({'id': [1, 2]})
df2 = pd.DataFrame({'id': [2, 3]})
print(pd.merge(df1, df2, on='id', how='outer', indicator=True))
id _merge
0 1 left_only
1 2 both
2 3 right_only
print(pd.merge(df1, df2, on='id', how='outer', suffixes=('_left', '_right')))
id
0 1
1 2
2 3
df = pd.DataFrame({'A': [1, 2, 3]})
df['A'] = pd.to_numeric(df['A'], downcast='integer')
print(df.dtypes)
A int8
dtype: object
df['A'] = df['A'].astype('float32')
print(df.dtypes)
A float32
dtype: object
df['col'] = ['a', 'b', 'a']
df['col'] = df['col'].astype('category')
print(df.dtypes)
A float32
col category
dtype: object
print(df.memory_usage(deep=True))
Index 132
A 12
col 211
dtype: int64
df = pd.DataFrame({'int': range(1000), 'flt': [1.0]*1000, 'cat': ['x']*1000})
df['int'] = pd.to_numeric(df['int'], downcast='unsigned')
df['flt'] = pd.to_numeric(df['flt'], downcast='float')
df['cat'] = df['cat'].astype('category')
print(df.dtypes)
int uint16
flt float32
cat category
dtype: object
df = pd.DataFrame({'val': [10, 20, 30, 1000]})
q_low = df['val'].quantile(0.05)
q_high = df['val'].quantile(0.95)
print(df[(df['val'] > q_low) & (df['val'] < q_high)])
val
1 20
2 30
df['norm'] = (df['val'] - df['val'].mean()) / df['val'].std()
print(df)
val norm
0 10 -0.520336
1 20 -0.499931
2 30 -0.479525
3 1000 1.499792
df['scaled'] = (df['val'] - df['val'].min()) / (df['val'].max() - df['val'].min())
print(df)
val norm scaled
0 10 -0.520336 0.000000
1 20 -0.499931 0.010101
2 30 -0.479525 0.020202
3 1000 1.499792 1.000000
df = pd.DataFrame({'id': [1, 1, 2]})
print(df.duplicated())
0 False
1 True
2 False
dtype: bool
print(df[df.duplicated()])
id
1 1
df = pd.DataFrame({'a': [1, 2], 'b': [3, 4]})
print(df.apply(lambda row: row['a'] + row['b'], axis=1))
df = pd.DataFrame({'first': ['Alice', 'Bob'], 'last': ['Smith', 'Jones']})
df['full'] = df['first'] + ' ' + df['last']
print(df)
0 4
1 6
dtype: int64
first last full
0 Alice Smith Alice Smith
1 Bob Jones Bob Jones
df = pd.DataFrame({'first': ['Alice', 'Bob'], 'last': ['Smith', 'Jones']})
df['full'] = df['first'] + ' ' + df['last']
print(df)
first last full
0 Alice Smith Alice Smith
1 Bob Jones Bob Jones
df = pd.DataFrame({'score': [45, 67, 89, 91]})
df['grade'] = pd.cut(df['score'], bins=[0, 60, 80, 100], labels=['F', 'B', 'A'])
print(df)
score grade
0 45 F
1 67 B
2 89 A
3 91 A
df = pd.DataFrame({'x': [1, 2, 3], 'y': [1, 4, 9]})
print(df.corr())
x y
x 1.000000 0.989743
y 0.989743 1.000000
df = pd.DataFrame({'col': ['a', 'b', 'a', 'c']})
print(df['col'].value_counts())
col
a 2
b 1
c 1
Name: count, dtype: int64
summary = {
'cols': df.columns.tolist(),
'dtypes': df.dtypes.tolist(),
'nulls': df.isnull().sum().tolist()
}
print(pd.DataFrame(summary))
cols dtypes nulls
0 col object 0
Score: 200
Category: basics